

Blog
Modern layer farming equipment systems define industrial egg production efficiency across commercial poultry farms.
Equipment selection determines production stability, feed utilization efficiency, and long term operational cost structure.
Core systems include cage structures, feeding automation, drinking systems, egg collection lines, manure handling units.
Global demand continues expanding across Asia, Middle East, and South America poultry industries.
Modern layer farming equipment supports high density poultry production systems.
Poultry farming equipment determines feed efficiency and egg yield stability.
Get professional poultry farm construction guidance, equipment selection solutions, and the latest price lists, whatsApp to +8618830120193, +2348111199996, or click to learn more.
 Group Equipment")
Contact Us To Received Your Customized Poultry Farm Plan
Headquarters And Branchs
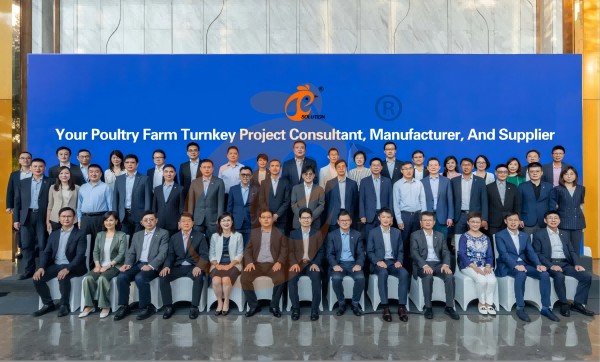
Hong Kong Headquarter Management Team
Hong Kong Headquarter Taiyu Industrial Group CO., LTD
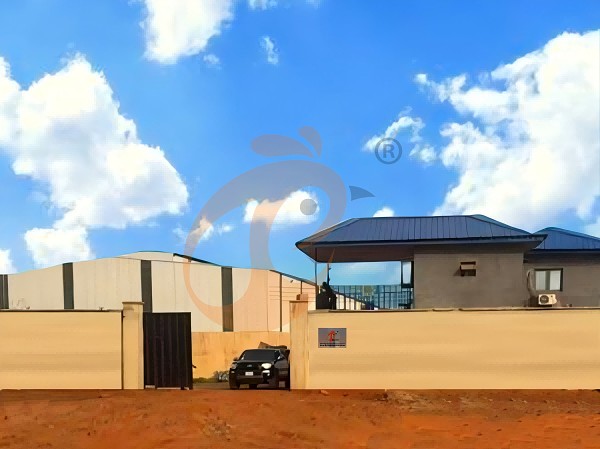
China Hebei Best Machinery And Equipment CO., LTD
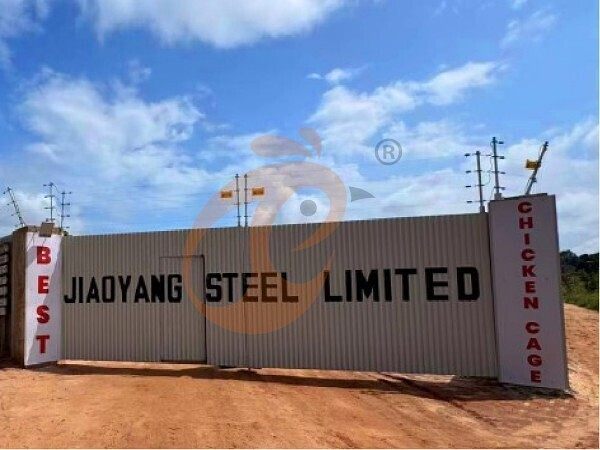
Nigeria Vanke Machinery And Equipment CO., LTD
Tanzania Best Machinery And Equipment CO., LTD
Ethiopia Best Hebei Machinery Manufacturing PLC

Reception /24 WhatsApp NO. : +8618830120193
FAQ
What Types Of Poultry Farm Equipment Are Essential In Poultry Chicken Production Systems?
Drinking systems provide 200–300 ml water per bird per day maintaining hydration balance, stabilizing metabolism, and improving nutrient absorption efficiency in controlled poultry farming conditions.
Ventilation equipment supports airflow rates of 5–7 m³ per kg live weight per hour ensuring heat removal, gas exchange stability, and maintaining optimal air quality for high-density poultry production systems.
How Does Poultry Farm Equipment Improve Production Efficiency In Poultry Chicken Farming?
Environmental control systems improve feed conversion ratio by 3%–6% through stable temperature and humidity management, supporting consistent broiler growth performance across full production cycles.
Integrated equipment reduces mortality rate by 2%–4% by maintaining controlled living conditions, improving disease prevention, and ensuring stable physiological performance in commercial poultry operations.
What Capacity Standards Are Required For Poultry Farm Equipment In Poultry Chicken Houses?
Water supply systems maintain flow rates of 1.0–1.5 liters per minute per line section ensuring stable pressure and continuous hydration for dense poultry populations.
Ventilation fans provide 25000–40000 m³ per hour airflow per unit ensuring effective heat dissipation and maintaining uniform environmental conditions throughout the poultry house.
Message
Products recommended
 HK Headquarter Offers EU-standard Poultry Farm Solutions, Manufacture Poultry Farm Equipment1. Continuous communication with the EU and the US
2. China, Nigeria, Ethiopia, Tanzania branch companies and factories
3. The products’ quality is customized for local poultry farms
4. Poultry cage and poultry farm equipment stock for sale
5. 24 online reception Whatsapp NO. : +8618830120193,contact us to get full informationRead More China Branch Offer Poultry Farm Business Plan, Manufacture Poultry Farm Equipment1. Address: Flat/RM 2416, 24/F, Runxing Building, Youyi Nan Street, Shijiazhuang City, Hebei Province, China
2. Poultry cage and poultry farm equipment factory and stock for sale
3. Customized for local poultry farms
4. Quality and design are based on Euro
5. 24 online reception Whatsapp NO. : +8618830120193Read More Nigeria Branch Offer Poultry Farm Business Plan, Manufacture Poultry Farm Equipment1. Address: After Sinoma Office, 200 Meters Near Danco Filling Station, Lagos/Ibadan Expressway, Lagos State, Nigeria
2. Poultry cage and poultry farm equipment factory and stock for sale
3. Customized for Nigerian poultry farms
4. Quality and design are based on Euro
5. 24 online reception Whatsapp NO. : +8618830120193Read More Ethiopia Branch Offer Poultry Farm Business Plan, Manufacture Poultry Farm Equipment1. Address: WR93+FQ2, Addis Ababa, Ethiopia
2. Poultry cage and poultry farm equipment stock for sale
3. Customized for Ethiopian poultry farms
4. Quality and design are based on Euro
5. 24 online reception Whatsapp NO. : +8618830120193, contact us to get price listRead More Tanzania Branch Offer Poultry Farm Business Plan, Manufacture Poultry Farm Equipment1. Address: No.8, Sova Road, Msufini, Mlandizi, Kibaha, Pwani, Tanzania
2. Poultry cage and poultry farm equipment factory and stock for sale
3. Customized for Tanzanian poultry farms
4. Quality and design are based on Euro
5. 24 online reception Whatsapp NO. : +8618830120193Read More Fully Automatic H Type Layer Chicken Cage1. 30,000-100,000+ layers/house chooses it, Poultry farmers can achieve an egg production rate of 96-98%
2. A significant improvement over the 85-90% typically seen in manual systems
3. A typical poultry farm can expect a 30-40% reduction in labor costs due to the automation
4. Each feeding line efficiently supplies feed to around 100,000 hens per 30 mins
5. Reception /WhatsApp NO. : +8618830120193Read More Fully Automatic A Type Layer Chicken Cage1. 10,000-50,000 layers/house chooses it
2. Cleaner egg collection reduces breakage by 0.5%
3. Improved hygiene helps reduce mortality rate to <3%
4. 1–2 technicians can handle 15,000–30,000 birds
5. Reception /WhatsApp NO. : +8618830120193Read More Semi Automatic H Type Layer Chicken Cage1. 1,00-20,000 layers/house chooses it
2. Nipple drinkers flow 30–60 ML / min
3. Hot-dip galvanized (typical coating ≥ 275 g/m²)
4. Reduce ammonia by ~ 35–40%
5. Reception /WhatsApp NO. : +8618830120193Read More Semi Automatic A Type Layer Chicken Cage1. 1,00-20,000 layers/house chooses it, no rust for 10 years, no deformation for 15 years
2. Chickens live comfortably, you can raise them with peace of mind
3. Save water, save money—efficiency you can measure
4. Improve environment quality, and increase egg production rate
5. Reception /WhatsApp NO. : +8618830120193Read More


By clicking 'Allow All', you agree to the storage of cookies on your device to enhance site navigation, analyze site usage and assist with our marketing efforts.